Michigan
State Quick Facts
Population
10,037,261
Total State GDP
$622,562,700,000
State Land Area (Acres)
36,184,960
Land in Forest (Acres)
20,116,910
Land in Forest
56%
Land in Farms (Acres)
9,500,000
Land in Farms
26%
Number of Farms
45,300
Average Farm Size (acres)
210
Farm Real Estate Value (per acre)
$6,400
Agricultural Cash Receipts
$12,076,269,000
Cash Receipts from Crops
$6,858,140,000
Cash Receipts from Animals
$5,218,129,000
Top Ag. Commodities
Dairy Products, Milk
$2,975,347,000
Corn
$2,010,669,000
Soybeans
$1,642,491,000
Chicken Eggs
$861,296,000
Miscellaneous Crops
$756,793,000
Top Ag. Exports
Other Plant Products
$904,014,408
Soybeans
$877,612,521
Dairy Products
$480,029,778
Corn
$408,709,631
Feed and Other Feed Grains
$267,920,994
Alabama | Alaska | Arizona | Arkansas | California | Colorado | Connecticut | Delaware | Florida | Georgia | Hawaii | Idaho | Illinois | Indiana | Iowa | Kansas | Kentucky | Louisiana | Maine | Maryland | Massachusetts | Michigan | Minnesota | Mississippi | Missouri | Montana | Nebraska | Nevada | New Hampshire | New Jersey | New Mexico | New York | North Carolina | North Dakota | Ohio | Oklahoma | Oregon | Pennsylvania | Rhode Island | South Carolina | South Dakota | Tennessee | Texas | Utah | Vermont | Virginia | Washington | West Virginia | Wisconsin | Wyoming
Michigan Economic Contribution and Impact Research
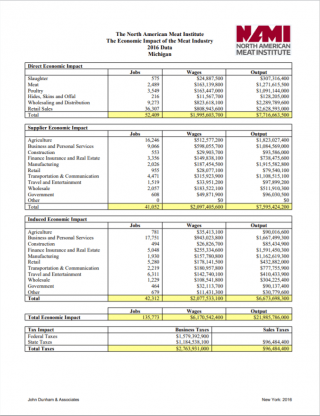
In 2022, Michigan generated around $12.1 billion in agricultural cash receipts with the highest valued commodities being dairy products, specifically milk, corn, and soybeans. That same year, the value of Michigan’s agricultural production and processing industries represented 3.0 percent of total state GDP. Some of the dollars generated by these industries end up being re-spent within the local economy, bringing additional value to the state through “multiplier effects.” Economic impact and contribution studies measure these effects, which can be broken down into direct, indirect, and induced economic effects.
Websites, reports, fact sheets, and articles related to the economic impacts and contributions of Michigan’s food, fiber, and forest industries can be found below.
Websites:
Information related to Michigan’s food, fiber, and forest industries can be found by visiting the following website(s):
File System Maintenance in Progress
We’re performing file system maintenance, and a few files may be unavailable right now. Please visit the Archives page to access available Contribution and Impact Research Documents. Thanks for your patience!Contribution and Impact Research Documents:
The following are current and historical studies, fact sheets, and articles related to Michigan’s food, fiber, and forest industries. These can be viewed and/or downloaded by clicking the images or links below:
2012MI_The_Economic_Impact_of_Michigans_Food_and_Agriculture_System-1dckha9
MI2016-Report-Economic_Analysis_of_Animal-_Agriculture_2005-2015-1tw05w1
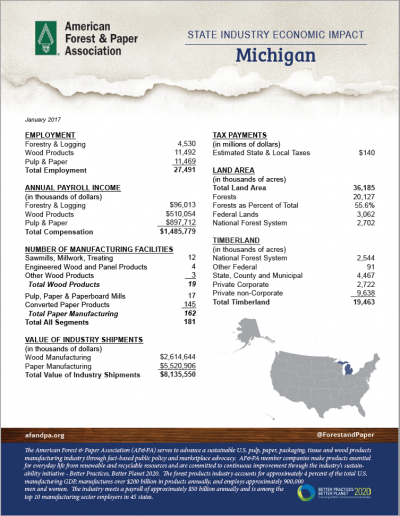
MI2017-FactSheet-AFPA_State_Industry_Ecomomic_Impact-1bawwql