Oregon
State Quick Facts
Population
4,233,358
Total State GDP
$297,308,900,000
State Land Area (Acres)
61,432,320
Land in Forest (Acres)
29,740,902
Land in Forest
48%
Land in Farms (Acres)
15,300,000
Land in Farms
25%
Number of Farms
35,500
Average Farm Size (acres)
431
Farm Real Estate Value (per acre)
$3,180
Agricultural Cash Receipts
$6,434,442,000
Cash Receipts from Crops
$4,252,423,000
Cash Receipts from Animals
$2,182,019,000
Top Ag. Commodities
Miscellaneous Crops
$1,905,206,000
Cattle and Calves
$1,045,098,000
Dairy Products, Milk
$743,143,000
Hay
$438,090,000
Wheat
$425,563,000
Top Ag. Exports
Other Plant Products
$1,161,222,914
Wheat
$248,397,335
Tree Nuts
$139,600,265
Beef and Veal
$137,596,362
Vegetables, Processed
$126,719,306
Alabama | Alaska | Arizona | Arkansas | California | Colorado | Connecticut | Delaware | Florida | Georgia | Hawaii | Idaho | Illinois | Indiana | Iowa | Kansas | Kentucky | Louisiana | Maine | Maryland | Massachusetts | Michigan | Minnesota | Mississippi | Missouri | Montana | Nebraska | Nevada | New Hampshire | New Jersey | New Mexico | New York | North Carolina | North Dakota | Ohio | Oklahoma | Oregon | Pennsylvania | Rhode Island | South Carolina | South Dakota | Tennessee | Texas | Utah | Vermont | Virginia | Washington | West Virginia | Wisconsin | Wyoming
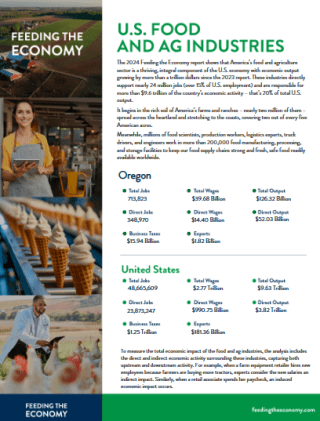
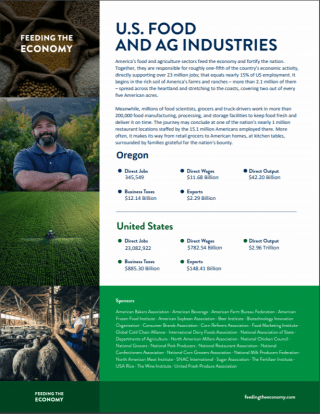
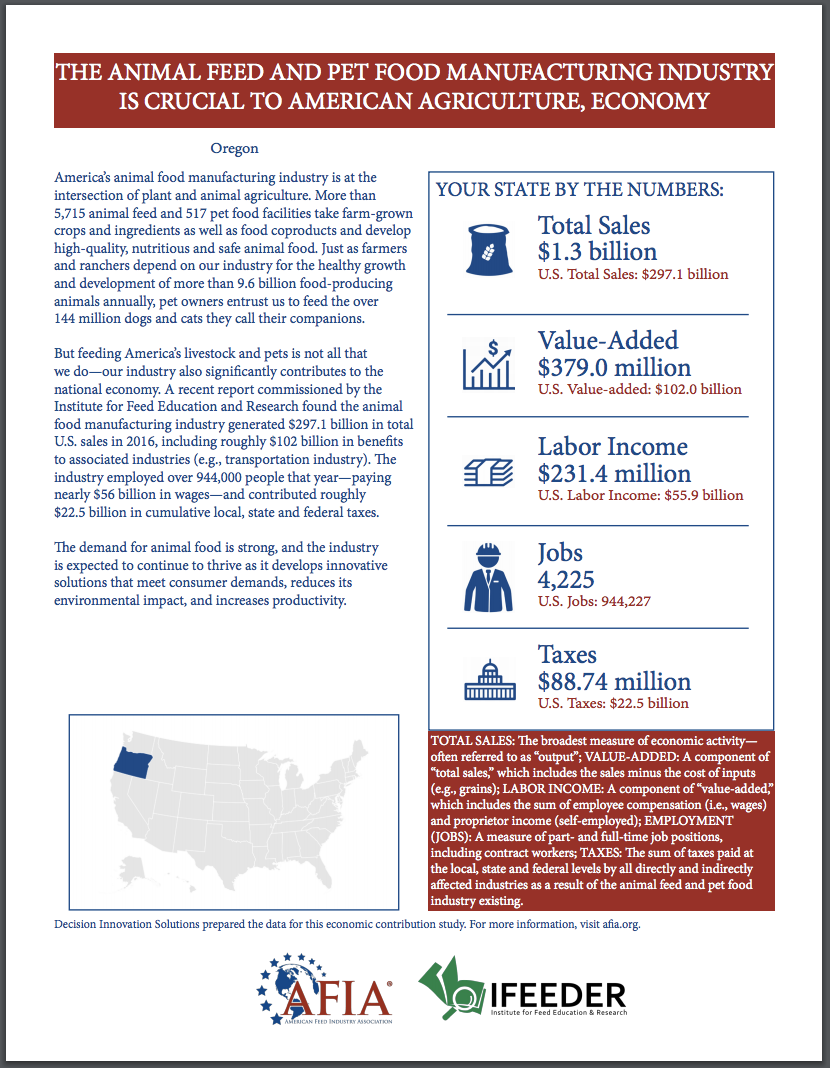
Oregon Economic Contribution and Impact Research
In 2022, Oregon generated around $6.4 billion in agricultural cash receipts with the highest valued commodities being miscellaneous crops, cattle and calves, and dairy products, specifically milk. That same year, the value of Oregon’s agricultural production and processing industries represented 5.4 percent of total state GDP. Some of the dollars generated by these industries end up being re-spent within the local economy, bringing additional value to the state through “multiplier effects.” Economic impact and contribution studies measure these effects, which can be broken down into direct, indirect, and induced economic effects.
Websites, reports, fact sheets, and articles related to the economic impacts and contributions of Oregon’s food, fiber, and forest industries can be found below.
Websites:
Information related to Oregon’s food, fiber, and forest industries can be found by visiting the following website(s):
Contribution and Impact Research Documents:
The following are current and historical studies, fact sheets, and articles related to Oregon’s food, fiber, and forest industries. These can be viewed and/or downloaded by clicking the images or links below:
2013OR_The_Economic_Impact_of_Shellfish_Aquaculture_in_Washington_Oregon_and_California-1sctzj9
2015OR_Oregon_Agriculture_Food_and_Fiber_An_Economic_Analysis-27jscbc
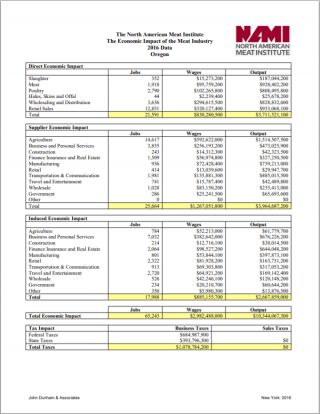
OR2016-Report-Economic_Analysis_of_Animal-_Agriculture_2005-2015-x7rloz
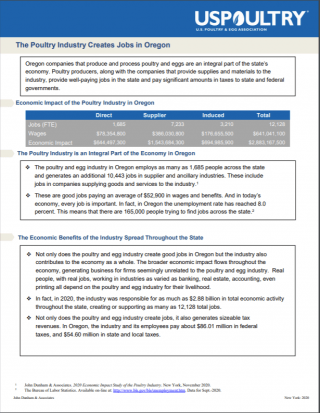
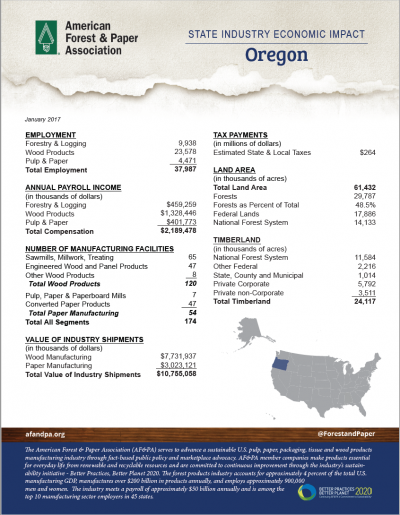
OR2017-FactSheet-AFPA_State_Industry_Ecomomic_Impact-1ucm5lz
*At present, there is no universally agreed upon standard methodology for producing economic impact or economic contribution reports. Please exercise caution when viewing and comparing reports as each may vary significantly in terms of source data and analysis and reporting methodology.